Where Do Greenhouse Gases (GHG) Come From?
To understand what we can do about greenhouse gases (GHG) we need to know where they are produced.
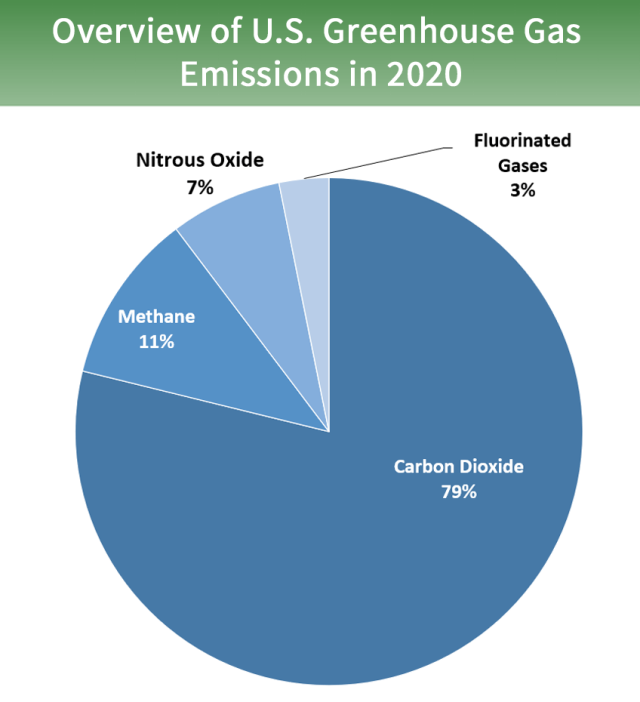
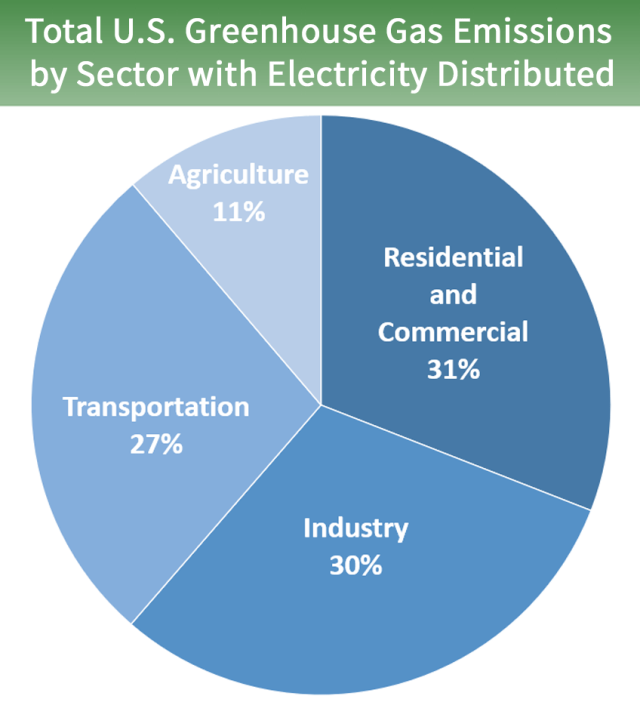
For the United States in 2020:


These charts are from the EPA from the article on sources of emissions on their website.
Global Emissions:
A total of 59 gigatons (gt; a gt is a billion metric tons) of global emissions (in CO2 equivalents, CO2e; see science behind climate change):
24gt (42%) energy
12 gt (20%) industry
9 gt (15%) agriculture
8 gt (14%) transportation
6 gt (10%) nature
From the book Speed and Scale ( bibliography)
Another way to look at where GHG come from, in 2020, out of 36 gt of CO2 produced by human activity:
The largest single contributor of manmade CO2 is still coal-powered generation of electricity, at 14.35 gt of 36 gt, about 40% of CO2 produced by human activity!
Next was burning of petroleum-based fuels, 12.36 gt, 34%.
Then burning natural gas at 7.62 gt, 21%.
But the devil is in the details. Folded into these groupings are specific GHG generating activities in our lives. Some examples:
Many of us are surprised by how much CO2 is released in concrete production (most from producing the cement that is part of the concrete). Concrete production is responsible for producing as much as 8% of global GHG emissions!
The buildings we use need a vast amount of energy for heating, cooling, lighting, and maintenance. Some estimate this creates a quarter of GHG, not even including the concrete used for construction of the building.
Much of atmospheric methane is produced by natural events, but methane emissions from human activities are a powerful driver of climate change. Landfill emissions include methane from rotting food, a powerful GHG. Food is the single most common material landfilled or burned, comprising almost a quarter of landfilled and combustible solid waste. The energy sector is a major source of methane emissions from human activity, second only to agriculture. Half of that is from China, the United States, Russia and Brazil. Coal-related methane emissions alone in China produce as much CO2 equivalents as all of sub-Saharan Africa. Super-emitting events like those in Turkmenistan produce more CO2 equivalent than the UK! This is a good place to intervene, as with current technology methane emissions super-emitting event could be reduced by 90%, and over all methane emissions globally could be decreased by 75%.
Under agriculture listed above, food waste is folded in. Food waste goes beyond whether or not it produces methane in landfills or smoke when burned. There is the wasted fertilizer, soil degradation, water, processing, transportation, and possibly energy for refrigeration. Of course, some waste is part of every human endeavor, but so much of food waste is unnecessary. The EPA estimates that food waste in the US is equal to the emissions of 42 coal-fired power plants.
Cryptocurrency computer “mining” is a vast source of GHG. One estimate is that Bitcoin alone produces the same amount of GHG that the nation of Greece does.
Health care produces 4.6% of global greenhouse gas emissions, but 8.5% of the emissions in the United States, where it also generates 5 million tons of waste each year! Much of this is obtaining raw materials, supply chain, transportation, manufacturing, and landfill waste, so it is under several parts of the pie charts above. Health care workers are making efforts, advocating for sustainable health care.
And that is a story we see repeated elsewhere. The devil is certainly in the details, and there are a lot of them!
Additional Resources
These books discuss GHG in depth:
Knowledge To Power, the comprehensive handbook for climate science and advocacy. John Perona. Ooligan Press, Portland State University, 2021. Excellent background and discussions of relevant topics by a scientist, academic, lawyer, activist. I found this book very useful.
The Carbon Almanac, it’s not too late. Forward by Seth Godin (This is a large collaboration by the Carbon Almanac Network). Portfolio Penguin, 2022.
The Thinking Person’s Guide to Climate Change. Robert Henson. AMS books, 2019. This is from the American Meteorological Society. At almost 500 pages I haven’t tried to read it through, but it is a good reference with a lot of great information.
Saving Us, a climate scientist’s case for hope and healing in a divided world. Katharine Hayhoe One Signal Publisher (Simon and Schuster), 2021. The title says it all. A climate scientist, with street cred, she is the chief scientist for The Nature Conservancy. Much in here about communicating and reaching out. She lives in Texas and is an evangelical Christian, so she has walked that walk and talked that talk. Readable and a bit optimistic.
Drawdown, the most comprehensive plan ever proposed to reverse global warming. Edited by Paul Hawken. Penguin Books, 2017. This is a massive undertaking called “Project Drawdown,” a review and assessment with short discussions of pros, cons and economics of 100 tactics to draw down carbon from the atmosphere, all ranked. Well researched. Worth having even if a bit dated. I hope for an updated edition. Good to peruse.
Speed and Scale, an action plan for solving our climate crisis now. John Doerr. Penguin, 2021. Well written by a venture capitalist, so a certain perspective. This is one area we need to look for solutions, in the real world we live in. Good to peruse as there are relatively short discussions.